

Insights and reports
Insights brings the figures of the rest of Akollo together: tasks completed, hours tracked, cycle time, project health, team capacity and detailed time reports. Every number is computed from the same records the other screens use, and you only ever see the people and projects you are allowed to see. Insights is in the main sidebar; the detailed time reports and exports sit next to it under Time.
Who uses it
| Role | What they do here |
|---|---|
| Employee | Reads their own figures and short notes about their own day, where the organisation shows them |
| Manager | Follows delivery and time for their teams, opens project health and capacity reports, approves weekly summaries |
| Project lead | Checks planned against actual time, the estimate at completion and milestones of their projects |
| Finance and HR | Run time reports for a period and export them as CSV or Excel |
| Administrator | Grants the report and export permissions and checks usage, including exported rows |
Main screens
| Screen | What it shows |
|---|---|
| Insights overview | Cards for tasks completed, hours tracked, time per person-day and median cycle time, each compared with the previous period; Throughput per week and Time by project |
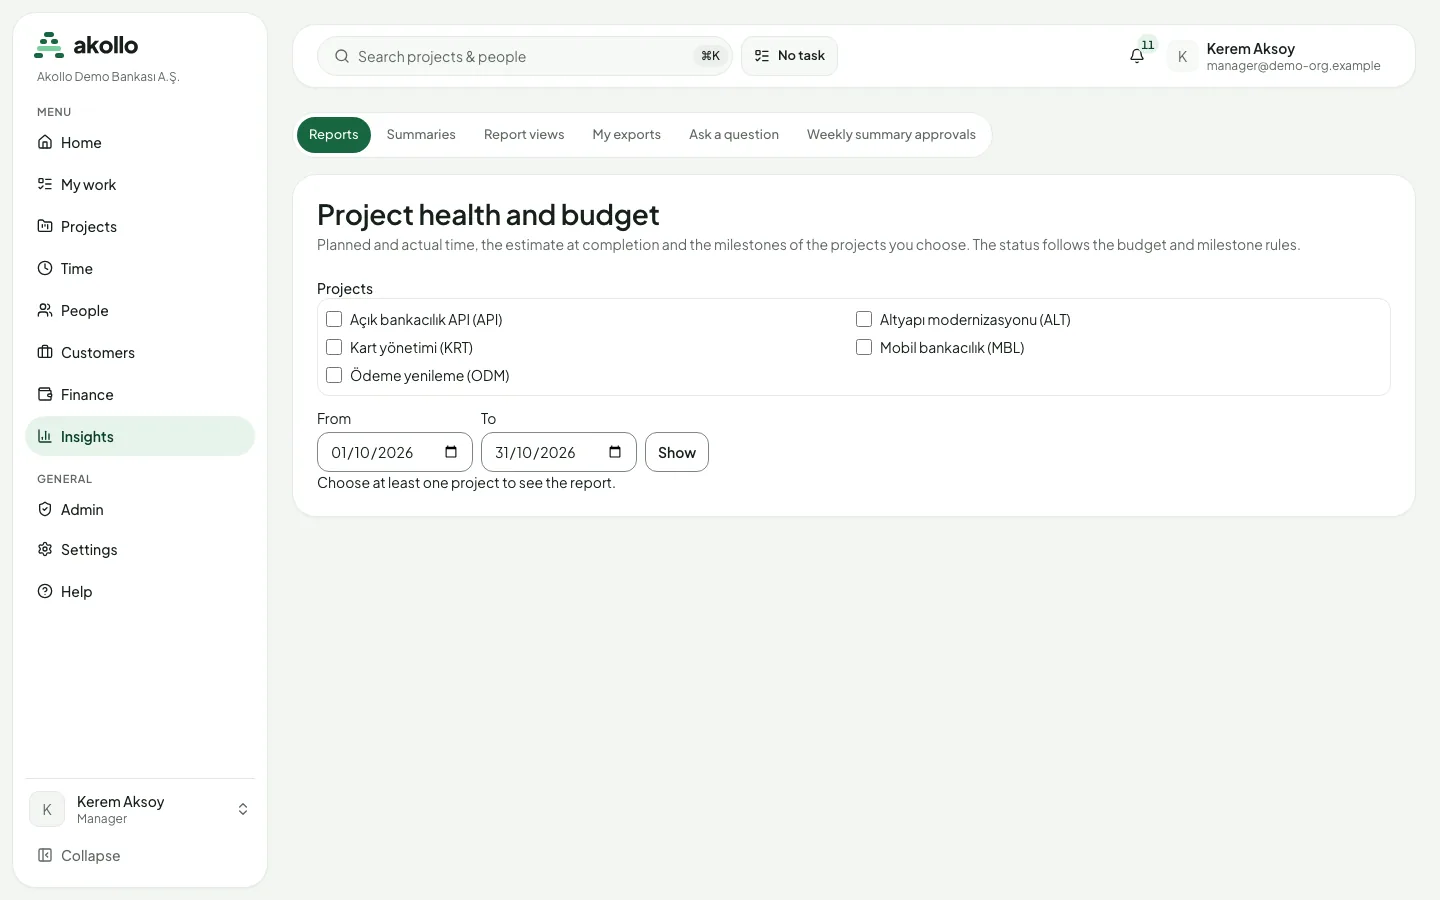
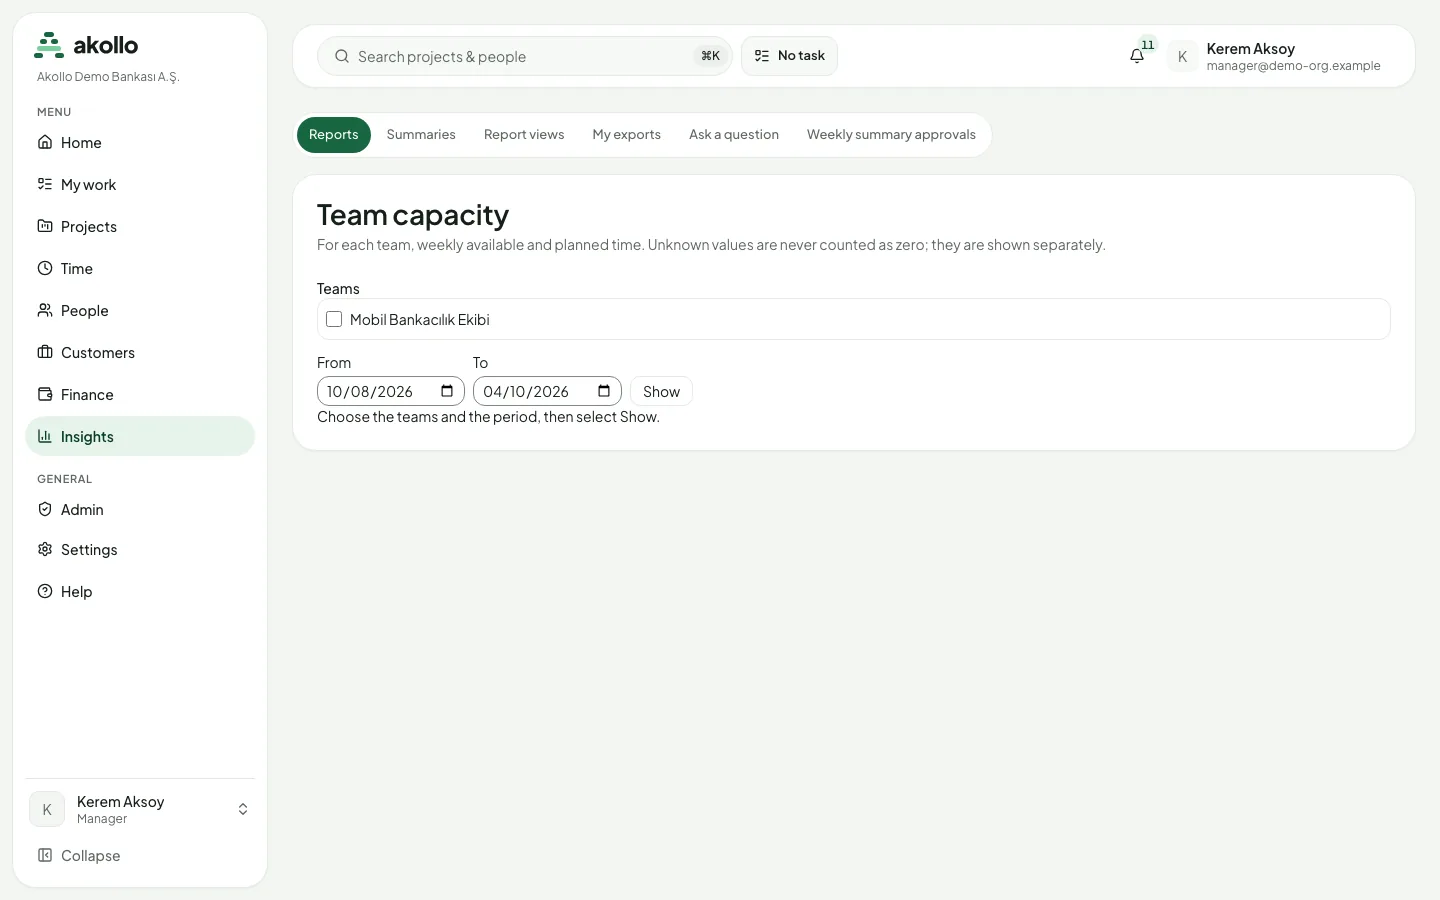
| Reports tab | Focused reports such as Project health and budget and Team capacity, and the time report catalogue |
| Summaries | A measured brief for one day or one week |
| Report views, My exports | Report setups you return to, and the files you exported |
| Ask a question | A question about your figures in plain words |
| Weekly summary approvals | Weekly summaries waiting for a manager before they are sent |
| Time reports and Exports | Detailed time figures for a period, and the files built from them |
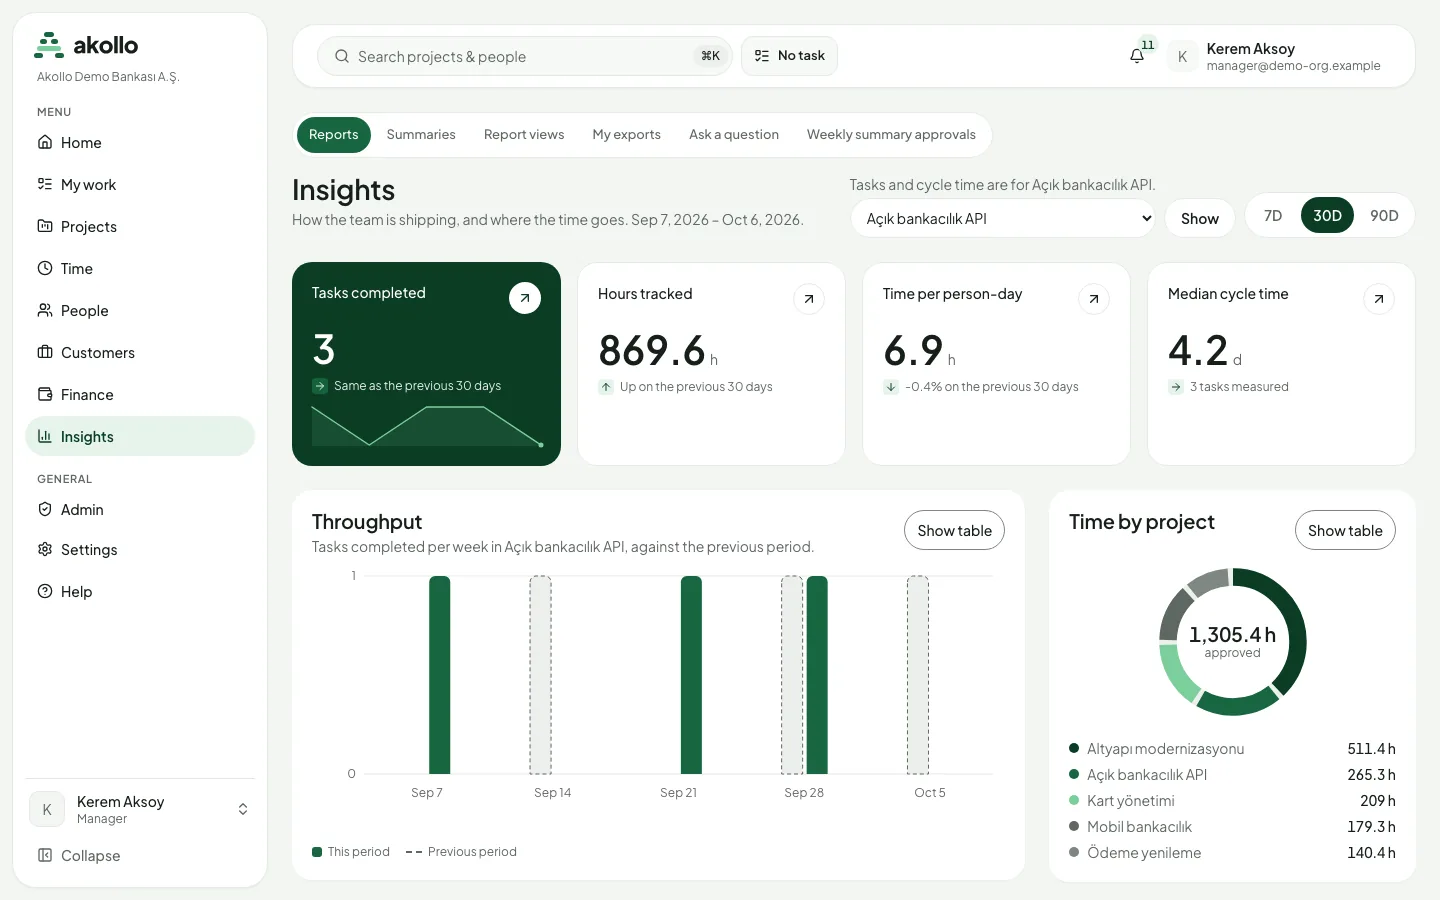
The overview covers the last 7D, 30D or 90D. Tasks and cycle time refer to the project you pick at the top; hours cover everyone in your scope. Show table turns any chart into a table of its figures.
The time report catalogue holds six reports: Time and activity, Weekly, Apps and web, Projects, Screenshots and Corrections. Each has a date range that starts as the current week, Monday to Sunday, in the organisation's time zone. Apps and web never includes page contents, and a screenshots report never replaces the permission to open the image itself.
Key tasks
Read the overview
Open Insights
Select Insights in the sidebar.
Choose the period and project
Pick 7D, 30D or 90D, choose a project for tasks and cycle time, and select Show.
Compare and drill in
Read each card against the previous period. Use Show table under Throughput or Time by project to see the figures.
Check a project's health and budget
Open the report
Open the Reports tab and choose Project health and budget.
Pick projects and a period
Select at least one project, set From and To, and select Show.
Read the status
Compare planned and actual time, the estimate at completion and the milestones. The status follows the budget and milestone rules, so you can see why a project is flagged.
Compare team capacity
Open Team capacity
On the Reports tab, open Team capacity.
Choose teams and dates
Select the teams and the period, then Show. You see weekly available and planned time per team. Unknown values are shown separately, never counted as zero.
Run a time report and export it
Set up the report
Open Time reports, enter From and Until, choose how to Group by and narrow it by team, employee, category or device. Select Apply.
Check freshness
Read the Data freshness panel. If some days are not summarised yet, Prepare summaries now prepares them for the period.
Create the export
Select Create export and choose CSV or Excel (XLSX). Follow it under Exports or My exports and download it before it expires.
Permissions
- Insights and the focused reports are for people who manage team work or projects. Opening a report also needs permission to read reports; without it, the page says reports are unavailable.
- Every report is limited to your scope: your own data, the teams you manage, or the whole organisation for an administrator. Employee choices in the filters only list people you may see, and project choices appear when you manage projects or review tasks.
- Create export is shown only with the export permission. Your scope is checked again on every download.
- A support session can read what it is allowed to see and cannot create exports or approve summaries.
What the AI can do here
- Summaries state counted figures only: who they cover, the dates and the source. There is no invented narrative; when there is not enough measured time, the page says the data is insufficient. A summary never ranks people or recommends a change.
- Weekly summaries are drafts until a manager approves them on Weekly summary approvals.
- Night notes: during the night, Akollo can prepare a short project summary, schedule flags and a note about one timesheet day. Managers read them on the project and in Insights. They are suggestions and change nothing.
- Ask a question answers within your own report permissions.
See Skills and assistance and What assistance can see.
FAQ
Reports respect your scope. You see only the people and projects you are allowed to see, and employee choices in the filters are limited the same way.
Insights counts approved hours across your scope for the chosen period, while the timesheet shows one person's days. Check the period and the project you picked, and the Data freshness panel on Time reports.
CSV and Excel (XLSX), with the export permission. Values that a spreadsheet could run as a formula are written as plain text.
Scheduled delivery of reports is not part of the current release. Create an export when you need a file, or connect a BI tool to the datasets feed.
No. A summary may only state a counted figure, who it covers, the dates and the source. It never ranks people or recommends a change.
Yes. Time reports apply approved corrections on top and show the figures before and after them side by side.